
Google Analytics 4 (GA4) can feel overwhelming. There are countless reports, metrics and ways to explore your data, and it’s easy to get lost in the numbers without knowing what you’re actually looking for.
You don’t have to understand every report to get useful insights from your website analytics. A handful of regular checks can tell you a lot about who’s visiting your website, how they’re finding it and what they’re doing once they arrive.
When I review a website’s monthly performance, I focus on five areas in GA4. These give me a useful overview of traffic, audience behaviour and opportunities to improve a website’s performance.
1. First User Default Channel Group: Where Are My Visitors Coming From?
One of the first things I look at is First User Default Channel Group. This tells me how people first discovered my website.
GA4 groups traffic into channels such as:
- Organic Search: Visitors who find your website through unpaid search engine results, such as Google.
- Organic Social: Visitors who arrive from unpaid social media posts.
- Direct: Visitors who arrive without a clearly identifiable referral source, which can include people typing your URL directly into their browser.
- Referral: Visitors who click a link to your website from another website.
- Paid Search: Visitors who arrive through paid search advertising.
- Email: Visitors who arrive through links in emails, provided the traffic is correctly tagged.

I look at this report to understand which marketing activities are bringing new people to my website. If I’ve been investing time in SEO, for example, I want to see whether organic search is introducing new visitors to my site.
It’s also a useful way to spot opportunities. If referrals are a significant source of traffic, I might investigate which websites are sending visitors my way. If social media is driving traffic, I can look at whether that activity is translating into meaningful website engagement.
What I’m looking for: changes in traffic sources over time, whether my marketing efforts are attracting new visitors, and opportunities to invest more time in the channels that are working.
2. Device Category: How Are People Viewing My Website?
Next, I look at Device Category to understand what devices people are using to access my website.
GA4 groups visitors into three main categories:
- Desktop
- Mobile
- Tablet
This is a relatively simple report, but it can have a significant impact on how you approach your website’s design and usability.
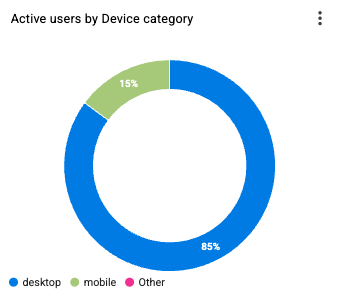
If most of your visitors are using mobile devices, your mobile experience deserves particular attention. Are your navigation menus easy to use? Is your text readable without zooming? Are your buttons easy to tap? Does your website load quickly on a mobile connection?
If most of your visitors use desktop computers, you may want to pay particular attention to how your website looks and functions on larger screens.
Of course, a website needs to work across all devices. But understanding how your audience accesses it helps you prioritise improvements.
What I’m looking for: proportion of visitors using each device and whether my website provides a good experience for the people who use it most.
3. Landing Pages and Channel Group: Which Pages Are Attracting Visitors, and How Do They Perform?
Your landing pages are the first pages visitors see when they arrive at your website in a particular session. They might be your homepage, a blog post, a service page or a product page.
I look at the Landing Page report alongside Session Default Channel Group to understand which pages attract visitors and how people arriving through different channels behave.
For example, someone who finds a blog post through Google may behave quite differently from someone who clicks a link to your homepage on Instagram. Looking at landing pages alongside traffic sources helps you understand those differences.
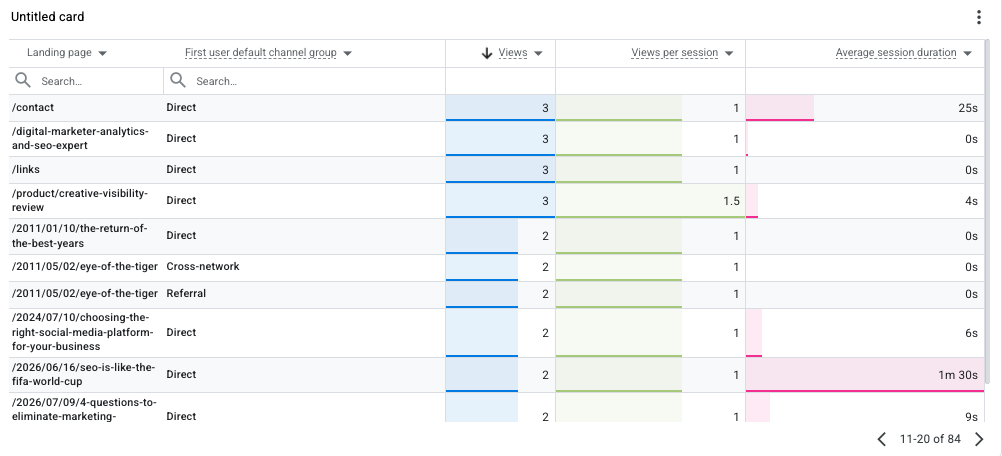
There are several metrics I pay attention to:
- Views: The total number of times pages have been viewed. This isn’t the same as the number of unique visitors, since one person can view a page more than once.
- Views per session: The average number of page views per session. This can help you understand whether visitors are exploring other pages, although a higher number isn’t necessarily better. Someone who finds exactly what they need on one page may have a perfectly successful visit.
- Average session duration: The average length of sessions. This can help you understand how long people spend on your website, although longer sessions don’t automatically indicate a better experience.
I also like to segment landing-page performance by channel. Comparing Organic Search, Organic Social, Direct and Referral traffic can reveal differences in visitor behaviour.
For example, a blog post might attract a lot of organic search traffic, but those visitors may not explore any other pages. Meanwhile, visitors arriving from a referral website might spend more time exploring your services. These patterns can help you identify which pages are attracting the right visitors and where there may be opportunities to improve the experience.
What I’m looking for: Which pages attract visitors, which channels bring people to those pages, and whether visitors are engaging with the content in ways that support my business goals.
4. Event Name: What Are Visitors Doing on My Website?
Traffic tells you that people are visiting your website. Events help you understand what they’re doing once they arrive.
In GA4, an event is an interaction or occurrence recorded on your website. Some events are collected automatically, while others need to be configured.
Depending on your setup, GA4 can automatically collect events such as page views and certain outbound link clicks. With enhanced measurement enabled, it can also record scrolls when someone reaches approximately 90% of a page.
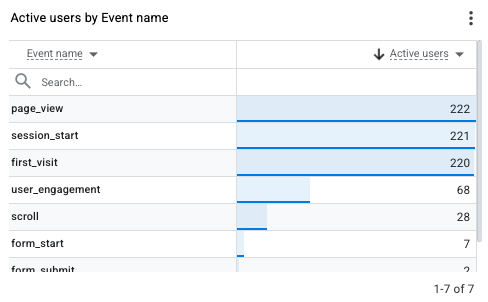
Other interactions require additional configuration. For example, you might want to track:
- Clicks on specific buttons, such as “Book a consultation” or “Get in touch.”
- Form submissions.
- Downloads of brochures or other resources.
- Adding products to a shopping cart.
- Beginning the checkout process.
- Completing a purchase.
GA4 has recommended event names for common actions, including add_to_cart, begin_checkout and purchase. However, these events aren’t necessarily collected automatically. They need to be implemented through your website, ecommerce integration or tag management setup.
You can also create custom events to track interactions that are particularly relevant to your business. For example, a service-based business might want to track clicks on a particular enquiry button, while a photographer might want to track brochure downloads.
The important thing is to focus on events that tell you something meaningful about your website’s performance. Not every click needs to be tracked, and not every event is a conversion. Prioritise the actions that help you understand whether your website is supporting your business goals.
Where possible, I also like to look at events alongside traffic sources and landing pages. This can help answer questions such as whether visitors arriving from organic search are submitting enquiry forms, or which pages are encouraging people to take the next step.
What I’m looking for: Whether visitors are taking meaningful actions on my website, which pages encourage those actions, and which traffic sources are contributing to them.
5. Active Users by Country: Where Is My Audience?
Finally, I look at Active Users by Country to understand where my website visitors are located.
For some businesses, location is central to their marketing. A local florist, for example, may primarily serve customers in a particular town or region. A business selling digital products, on the other hand, may have a much broader audience.
Looking at the countries from which visitors access your website can help you understand whether you’re reaching the people you want to reach.
If you’re a UK-based business targeting local customers but most of your traffic comes from elsewhere, it may be worth investigating why. On the other hand, if you’re selling internationally, visitors from several countries may be exactly what you want.

It’s important to remember that location data isn’t perfect. VPNs, privacy settings and other factors can affect the location GA4 reports. Country-level data also won’t necessarily tell you whether someone is in your target town or city.
What I’m looking for: Whether my website is attracting visitors from the locations that matter to my business and whether my audience matches the one I’m trying to reach.
Don’t Just Look at the Numbers. Look for Trends.
While I check these five areas regularly, I don’t treat each report as an isolated set of numbers. The real value comes from looking at how they relate to one another and how they change over time.
For example:
- Has organic search traffic increased since publishing a new blog post?
- Are mobile visitors engaging with the website differently from desktop visitors?
- Which landing pages attract visitors who go on to make an enquiry?
- Are visitors from a particular referral source taking meaningful actions?
- Have changes to the website coincided with improvements or declines in engagement?
I also pay attention to unusual changes. A sudden increase in traffic might be encouraging, but it’s worth understanding where those visitors came from and whether they’re relevant to your business. Equally, a drop in traffic isn’t necessarily a problem if the visitors you’re attracting are more likely to become customers.
Comparing data over time, rather than looking at a single month’s figures in isolation, helps you distinguish meaningful trends from normal fluctuations.
Make Your Website Data Work for You
You don’t need to spend hours in GA4 every month to understand your website’s performance. A regular review of a few key reports can help you see what’s working, identify opportunities and make more informed decisions about where to focus your marketing efforts.
The most useful metrics will depend on your business and what you want your website to achieve. A service-based business might prioritise enquiry forms and consultation bookings, while an online shop will want to pay closer attention to ecommerce events and purchases.
Ultimately, the point of website analytics isn’t to collect as many numbers as possible. It’s to understand whether your website is doing its job and what you can do to make it work better.
If you’re not sure what your website data is telling you, start with one question: What do I want my website to do for my business? Once you know the answer, it’s much easier to identify which metrics are worth paying attention to.
Need a Little Help With Your Analytics?
Not sure what your website analytics are telling you? Whether you have questions about GA4, need help setting up your analytics or want a professional perspective on your website traffic, I’d love to help. Get in touch and let’s make sure your website data is giving you the insights you need to make informed decisions about your business.
Leave a Reply